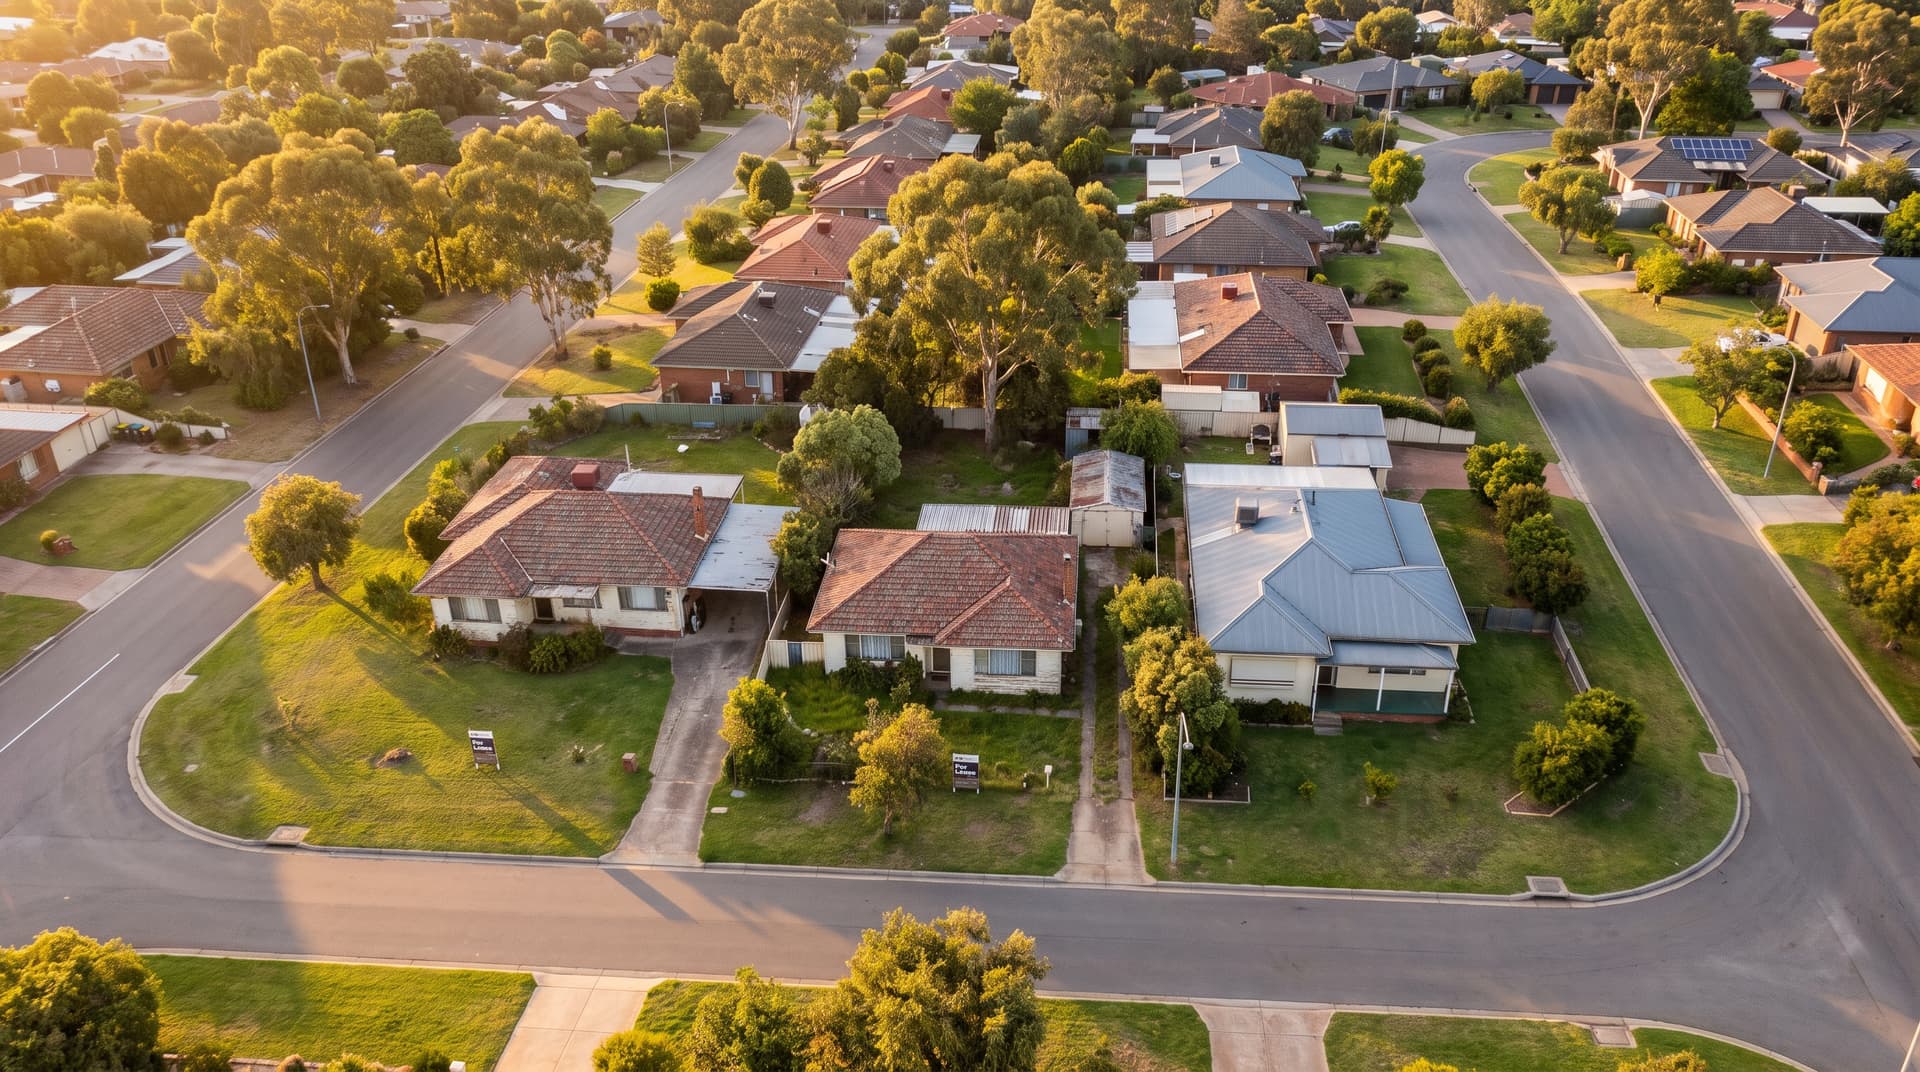
Three numbers sit at the top of most suburb profiles, and each looks like a verdict on its own: the owner-occupier ratio, the vacancy rate, and days on market. Read one at a time and each will mislead you, because each answers a different question. The owner-occupier ratio shows who owns a suburb long-term, the vacancy rate shows whether renters are absorbing stock, and days on market shows how fast homes clear. Read them together against the right benchmarks and you can see whether supply is running ahead of demand or behind it.
Why the headline number gives you false confidence
Each metric is a snapshot of a different layer of the market. The owner-occupier ratio is stock, a count of who holds the homes. The vacancy rate is flow, whether rental stock is being taken up. Days on market is momentum, how quickly the whole thing clears.
| Signal | What it measures | Speed | Benchmark |
|---|---|---|---|
| Owner-occupier ratio | Who owns the suburb long-term | Slow, census-derived | 65–70% is a common peak-selling window |
| Vacancy rate | Whether renters absorb stock | Fast, leads rents | 2.0–3.0% healthy; above 3.0% is oversupply risk |
| Days on market | How fast homes clear | Current momentum | National 35 days; combined capitals 33 |
A single number cannot carry all three jobs. A high rental ratio can signal weaker growth, but it should never be used in isolation as a suburb screen. The best suburb research combines ownership mix with supply, amenity, affordability, buyer demand and economic activity rather than leaning on any one metric. Reading all of them together is what separates an analyst from someone reading numbers off a screen. The three signals move at different speeds, so an analyst reads them in order: structural ownership first, then rental demand, then momentum.
Owner-occupier ratio: the structural read
The owner-occupier ratio comes from the census, so it barely moves between counts. That slowness is its job. It is the who-is-buying-here-long-term signal, the one vacancy rate and days on market cannot touch.
It matters for growth, and Cotality measured how much. In a 16-year study, units in owner-occupier-heavy suburbs grew 99% between 2010 and 2026, against 65% in investor-heavy suburbs. Applied to the national median unit value at the start of that period, the gap is an estimated $148,000 in capital gains.
The mechanism is slow and unglamorous. Owner-occupiers renovate, extend and maintain their homes, which lifts the quality and value of a suburb over time.
One shift changes how you read the number. A rising rental ratio is more useful than the current ratio, because it shows where investor concentration is building. A suburb at 70% owner-occupied but drifting down each year could be riskier than one holding steady at 60%. On the way out, some experienced investors suggest a suburb reaching around 65% to 70% owner-occupiers signals the best time to sell.
Vacancy rate: the rental-demand read
Vacancy rate is the percentage of rental properties in a suburb that are unoccupied at any given time. It is the fastest of the three signals and the earliest to turn. Vacancy moves before rents do, so it is the earliest reliable warning that a rental market is tightening or softening.
The long-run national average for established rental markets sits around 2.4%. A healthy, balanced market operates within 2.0% to 3.0%. Below 2.0% is tight, above 3.0% is oversupply risk.
Those thresholds carry weight because they were measured across a wide dataset. Across 7,000+ Australian suburbs, a vacancy rate above 3.0% is associated with an 84% probability of declining gross rental yield within the following two quarters. Push past 5.0%, and that level has historically correlated with below-median capital growth over the following 24 months in 79% of observed cases.
Check for traps before you trust a low reading. It can be temporary if a large new-supply pipeline is about to land, can reflect seasonal timing, or can mix dwelling types. Tight vacancy carries more risk when hundreds of apartments are about to settle than when nothing is in the pipeline.
Days on market: the momentum read
Days on market measures absorption, whether buyers are clearing stock or vendors are waiting. The raw number means little without the context behind it.
Sydney in mid-2026 is a clean worked example. The median days on market sits at 41, above the combined-capitals figure of 33 and the national figure of 35. On its own that says slower market. The context explains why: total listings are up +14.3% year on year while new listings fell -14.1%, so the growing pool of stock is homes sitting unsold. Homes are accumulating because sales are slow, while new listings actually fell.
Two corroborating signals complete the picture. Sydney dwelling values fell -1.4% in July 2026 to a median of $1,244,617, with a quarterly decline of -4.0%. The auction clearance rate came in at 55.6% for the week ending 16 August 2026, below the range typically associated with price growth.
Reading the three together: an analyst’s checklist
Each signal cross-checks the other two. A high owner-occupier ratio plus a sub-3% vacancy plus falling days on market is a tight, owner-driven, absorbing market. A low owner-occupier ratio plus a rising vacancy plus rising days on market means supply is running ahead of demand.
When signals disagree, speed decides which to weight. The fast ones turn first. Days on market and vacancy move before the owner-occupier ratio, which barely shifts year to year. The slow metric is your anchor, the fast ones your warning lights.
Sydney shows the conflict clearly. Rents climbed +5.5% over the year to July 2026, houses up +6.1%, while the vacancy rate held steady at 1.6%, keeping conditions firm for landlords. Yet values fell, days on market stretched past the national median, and clearance softened. Rental demand stayed tight even as sales momentum faded.
Run the filter in this order for a shortlist. Vacancy first, because it moves first and screens out oversupply. Then days on market and clearance rate for current momentum. Then the owner-occupier ratio and its trend for structural quality. A suburb that clears all three earns a deeper look, and if you want the full method, start with how to research suburbs for investment property.
Where the data actually comes from
Each metric has a different source and a different freshness, which is why reading them together takes some assembly.
Ownership mix comes from the ABS Census, so it updates on census cycles and barely moves between them. Days on market and values come from data providers like Cotality, formerly CoreLogic, and the real estate portals. Vacancy is the hard one at suburb level, which is why providers like SQM Research and HTAG publish it segmented by dwelling type and updated quarterly.
Benchmark against the right peer group. A suburb of established houses belongs next to other established-house suburbs and its own LGA. A national 2.4% figure mixes apartments and greenfield estates, so it is a poor yardstick for a specific suburb. Live HTAG house reads as at 30 June 2026 show the spread: Hoppers Crossing VIC 2.10%, Wellard WA 2.67%, Craigieburn VIC 2.85%, the last down from 4.00% in December 2025.
That Craigieburn figure matters more as a trend than a level. It fell from 4.00% to 2.85% in six months, so a suburb that was oversupplied at the end of 2025 is moving back toward balance.
This three-signal read is the lens PropSpotter’s research brief applies to every suburb, each metric benchmarked against its peer group rather than shown as a bare number. You can run the filter yourself with the walkthrough above, or if you are weighing whether to pay someone else for the analysis, read how PropSpotter compares with a buyer’s agent.